Where Are The Savings Hidden
In this article we will look at price and affordability trends to examine which of the 2 major outlets offer the best deal
By Costy Team ·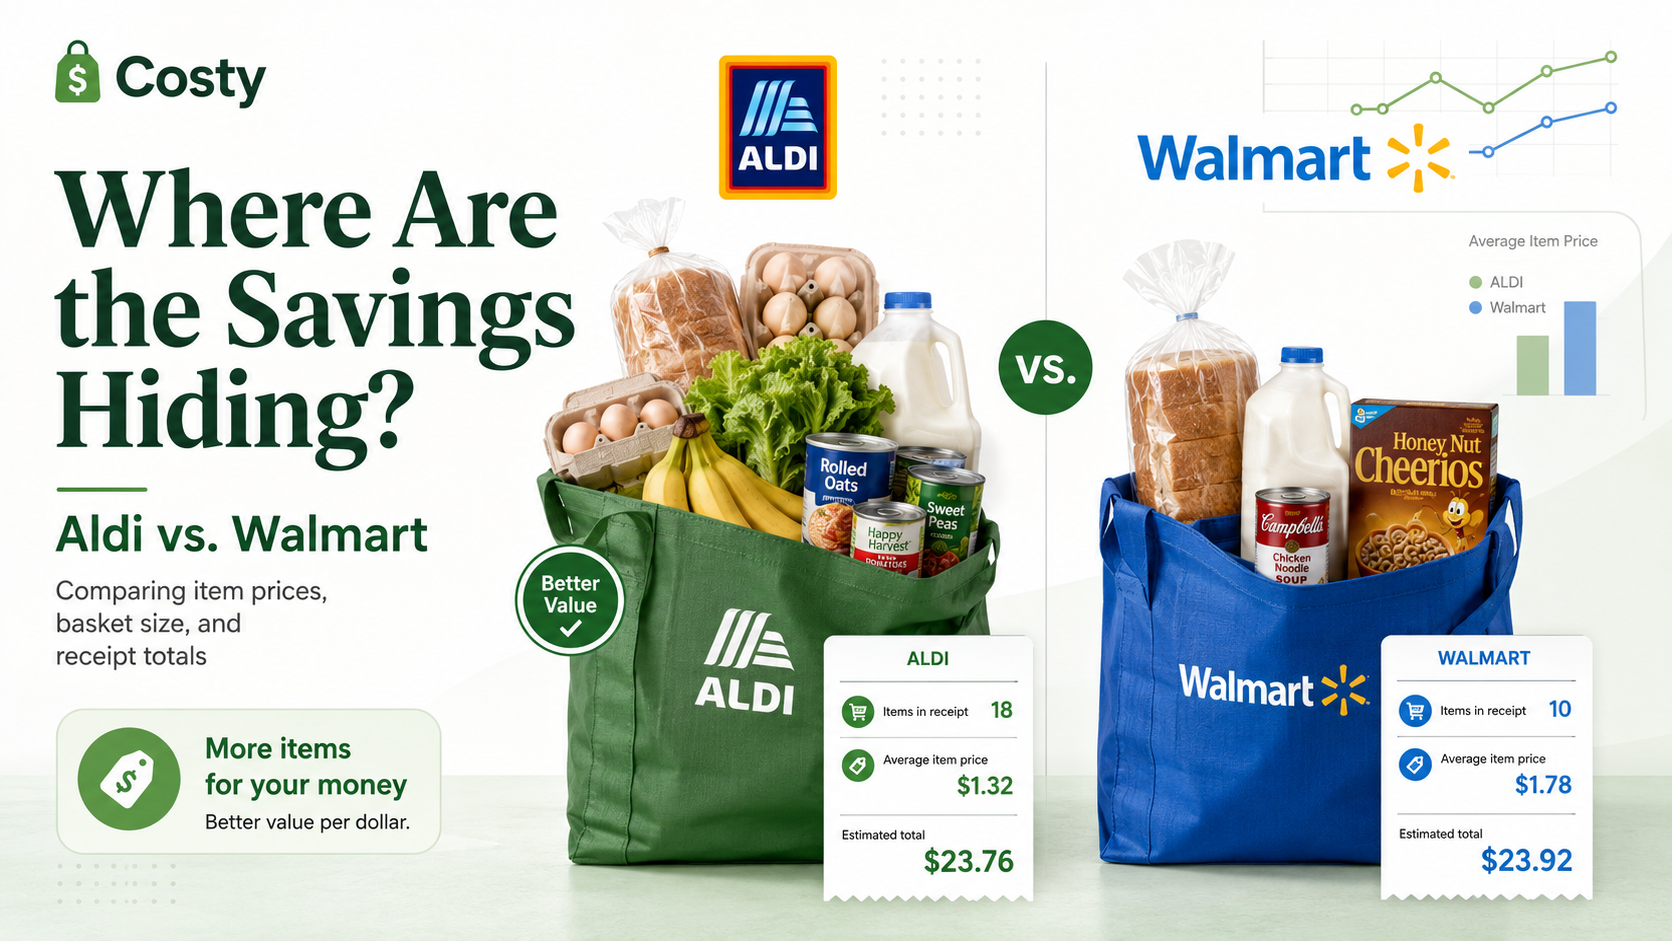
Where Are the Savings Hiding?
When comparing grocery stores, the cheapest-looking receipt does not always tell the whole story.
To understand which retailer appears more affordable, we looked at Costy data collected over the last 30 days from **Aldi and Walmart**. The comparison focuses on three simple metrics:
- Average item price
- Average items per receipt
- Average receipt total
Taken together, these numbers can reveal more than any one metric on its own.
**A note about the data:** Costy's dataset is still growing. These results reflect the receipts currently available to us and should be treated as early observations, not a definitive comparison of every Aldi and Walmart location.
Average Item Price
Let's start with the simplest comparison: **how much did the average item cost at each store?** We are taking a look across 50 receipts from the months of July to August, focusing on Aldi's and Walmarts between Missouri and Kansas
Average Item Price: Aldi vs. Walmart
Where the two stores had observations during the same period, Walmart's average item price was consistently higher than Aldi's. The August 22 data point is especially noticeable: Aldi's average item price was **$2.81**, compared with **$6.48 at Walmart**.
That does not mean the same products were necessarily twice as expensive at Walmart. The baskets may contain different products, brands, quantities, and categories. Still, the pattern is significant enough to warrant a closer look.
Price Alone Doesn't Tell the Whole Story
A lower average item price is useful, but affordability also depends on **how much you actually take home for the money you spend**.
For that, we can compare two additional measurements:
- How many items were purchased per receipt
- How much the entire receipt cost
Items Purchased vs. Receipt Total
This comparison reveals something more interesting than receipt totals alone.
On **August 8**, Aldi shoppers in the dataset purchased an average of **26 items for $101.91**, while Walmart shoppers purchased **20 items for $120.80**.
On **August 22**, the contrast was even stronger: Aldi averaged **24 items for $73.16**, compared with Walmart's **6 items for $41.43**.
A Walmart receipt can therefore have a lower total while still representing less purchasing power.
A Better Way to Think About Affordability
Imagine two restaurants.
At the first, **$15 buys you a burger**.
At the second, **$15 buys you a burger and fries**.
Both meals cost the same amount, but the second restaurant gives you more for your money.
Grocery affordability works in much the same way. The total at the bottom of the receipt matters, but so does **what you received in exchange for that total**.
That is why looking at average item prices, basket size, and receipt totals together can give us a much better picture than simply asking which store produced the cheaper receipt.
So, Which Store Looks More Affordable?
Based on the receipts currently available to Costy, **Aldi appears to offer more purchasing power per dollar than Walmart**.
The pattern in this dataset shows:
- Lower observed average item prices at Aldi
- Larger Aldi baskets on several comparable dates
- Receipt totals that do not rise proportionally with the additional number of items
The original data therefore points toward Aldi being the more affordable option within this particular sample.
However, there is an important limitation: we are not always comparing identical shopping baskets. Someone buying vegetables and pantry staples at Aldi cannot be directly compared with someone buying electronics, premium meat, or household products at Walmart.
As Costy's dataset grows, the strongest comparison will be to match **the same or equivalent products across stores** and calculate exactly how much a shopper could save.
The Real Question Isn't "Which Receipt Is Cheaper?"
It is:
**How much can you take home for every dollar you spend?**
That is where the savings may actually be hiding.
As Costy gathers more shopping data, we'll be able to compare retailers not only by receipt totals, but by products, categories, quantities, and eventually the cost of complete grocery baskets.
That should make it much easier to answer the question shoppers actually care about:
**Where does my money go the furthest?**
Conclusion
The early Costy data suggests that **Aldi currently provides better overall value than Walmart within this sample**. Aldi showed lower average item prices and, on several comparable dates, shoppers were able to purchase more items without their receipt totals increasing at the same rate. That does not mean Aldi will always be cheaper for every product or every shopping trip. The receipts in this dataset contain different products, brands, quantities, and categories, so these results should be viewed as an indication of a broader pattern rather than a definitive retailer ranking.
What the data does show is that **affordability is about more than the number at the bottom of a receipt**. A cheaper trip is not necessarily a better deal if you take home fewer items.
As Costy collects more receipts, we'll be able to make increasingly precise comparisons between equivalent products and complete shopping baskets.
For now, the data points to one useful takeaway:
**The best place to shop may not be the store where you spend the least — it may be the store where each dollar buys you the most.**