State Of The Food Basket
We will take a look at what the trends have been regarding the average persons grocery consumption
By Costy Team ·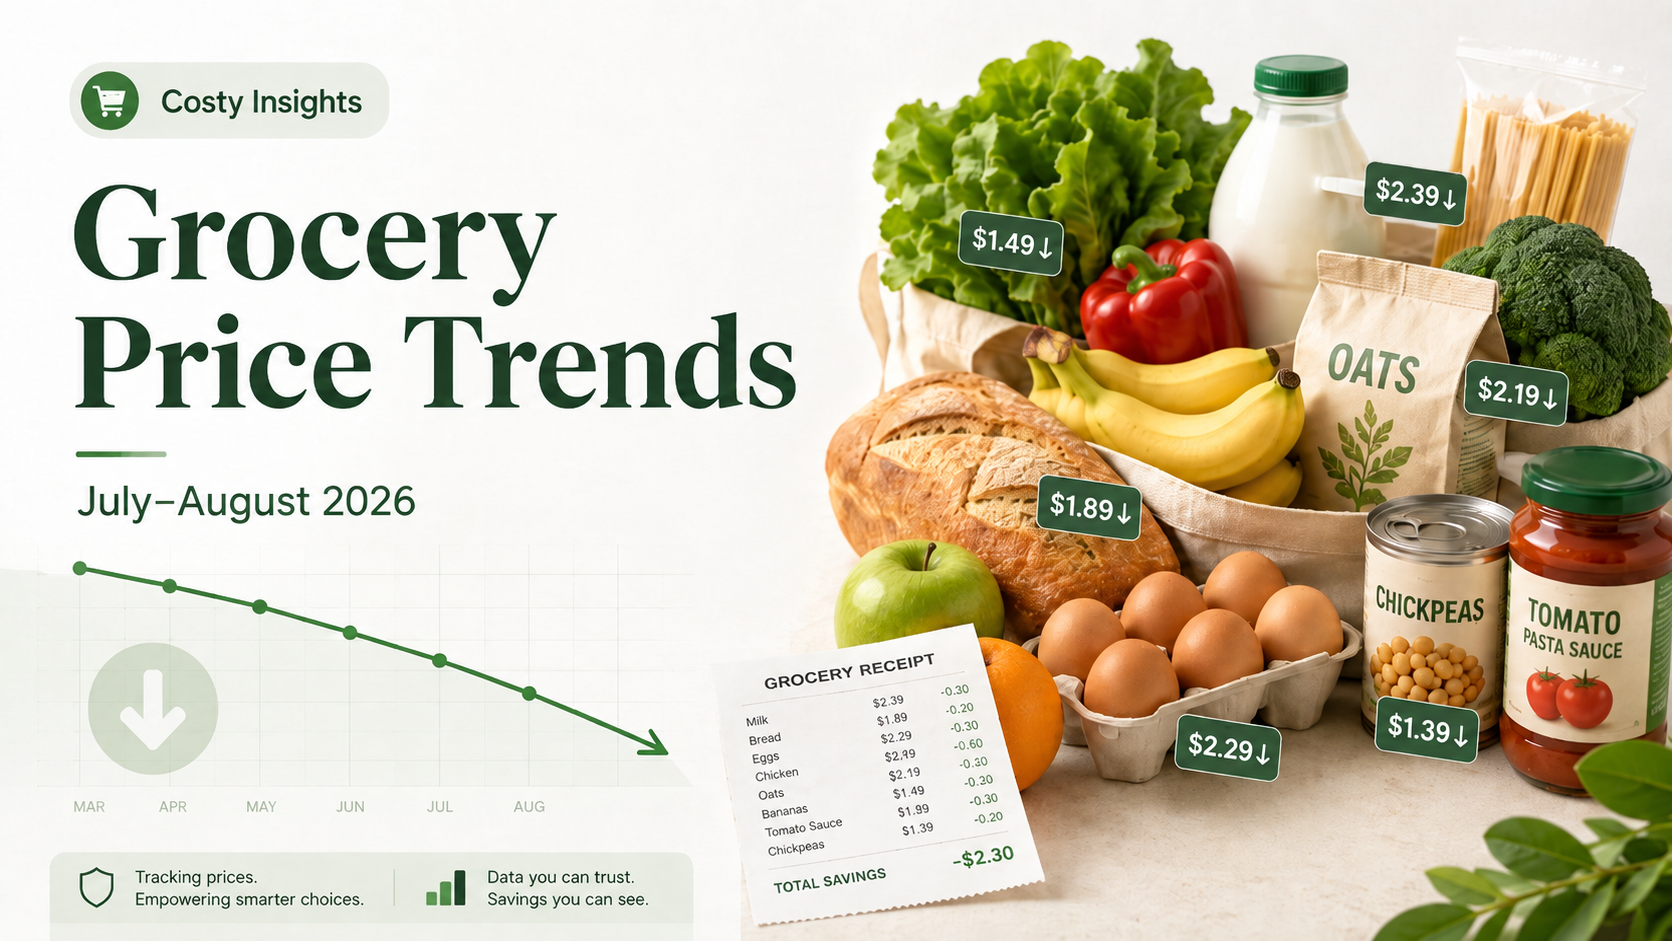
Grocery Price Trends: July–August 2026
Grocery prices can change surprisingly quickly. Between shifting trade conditions, tariffs, supply-chain disruptions, and changes in consumer demand. Keeping track of what everyday products actually cost can help households make better purchasing decisions.
At Costy, we're beginning to use real purchase data to identify those trends.
This report looks at grocery prices recorded by Costy between **July and August 2026**, including overall price movement, average prices at major retailers, and differences between common product categories.
**A note about the data:** Costy is still building its dataset. These figures are based on the receipts currently available to us and should be viewed as early indicators rather than measurements of the entire grocery market.
Overall Grocery Price Trend
Our available data indicates that average product prices declined between July and August.
Observed Grocery Price Change
From July to August, the products in our dataset showed an overall price change of approximately **-5.69%**.
In other words, the prices Costy observed were generally lower in August than they were in July.
That is encouraging for shoppers, but because this is our first major comparison period, we need more historical data before we can determine whether this represents a sustained downward trend or normal short-term price variation.
Average Prices by Retailer
The difference between retailers was substantial.
Across the products recorded during this period:
- **Aldi:** $3.27 average item price
- **Walmart:** $4.86 average item price
This does **not necessarily mean that Aldi is 33% cheaper than Walmart**, because the products purchased at each retailer may be different. However, it does show a noticeable difference in the average cost of items appearing on the receipts in our dataset.
Aldi
Aldi Average Item Price
Aldi's observed average item prices remained within a relatively narrow range of approximately **$3.01 to $3.58**.
Although our number of observations is still small, the available data suggests comparatively stable pricing during this period.
Walmart
Walmart Average Item Price
Walmart showed considerably more variation in our data, with recorded daily averages ranging from approximately **$2.22 to $5.77**.
Some of this variation likely comes from differences in the products purchased on each trip rather than individual products suddenly becoming dramatically more or less expensive.
As Costy collects more receipts, comparing the prices of identical or closely matched products will give us a much clearer picture of retailer-level price changes.
Prices by Product Category
Looking across all merchants, some of the most common grocery categories had the following average item prices:
| Category | Average Price | | --------------- | ------------: | | Dairy & Eggs | **$2.99** | | Bakery & Grains | **$3.58** | | Meat & Seafood | **$7.09** | | Snacks & Sweets | **$2.39** |
Of these categories, **meat and seafood were by far the most expensive**, averaging $7.09 per item.
Snacks and sweets had the lowest average price at $2.39, followed by dairy and eggs at $2.99.
These averages should not be interpreted as the price of a standard quantity of food. Product sizes, quantities, brands, and package types can vary significantly within each category.
Where People Shopped
Aldi generated the largest number of receipts in our dataset during this period, followed by Walmart.
The three most frequently represented merchants were:
- **Aldi**
- **Walmart**
- **Mr. K's Foodtown**
Receipt frequency does not necessarily indicate overall retailer popularity. It reflects the shopping activity represented within Costy's current dataset.
What Can We Take Away From This?
Our early data points toward **slightly lower grocery prices overall**, with an observed decline of approximately 5.69% between July and August.
We also noticed an interesting difference between the two retailers with the most data:
**Aldi prices appeared relatively stable**, while **Walmart's average purchase prices fluctuated considerably more from one recorded shopping trip to another.**
However, there is not yet enough data to confidently say that grocery prices are entering a sustained downward trend.
As Costy receives more receipts from more stores, locations, products, and shoppers, these reports should become considerably more accurate.
That will also allow us to move beyond simple averages and answer much more useful questions:
- Which grocery stores are actually becoming cheaper?
- Which products are increasing in price the fastest?
- Are staple foods becoming more or less affordable?
- Which retailer consistently offers the lowest price for the same product?
- How are prices changing week over week, month over month, and year over year?
This is only the beginning of Costy's grocery price dataset.
**More receipts mean better data — and better data means better ways to save.**