How Far Can a Dollar Get You in August 2026?
We compared Costy receipt data from Walmart and ALDI across Missouri and Kansas to see how many grocery items shoppers got for every dollar spent.
By Costy Team ·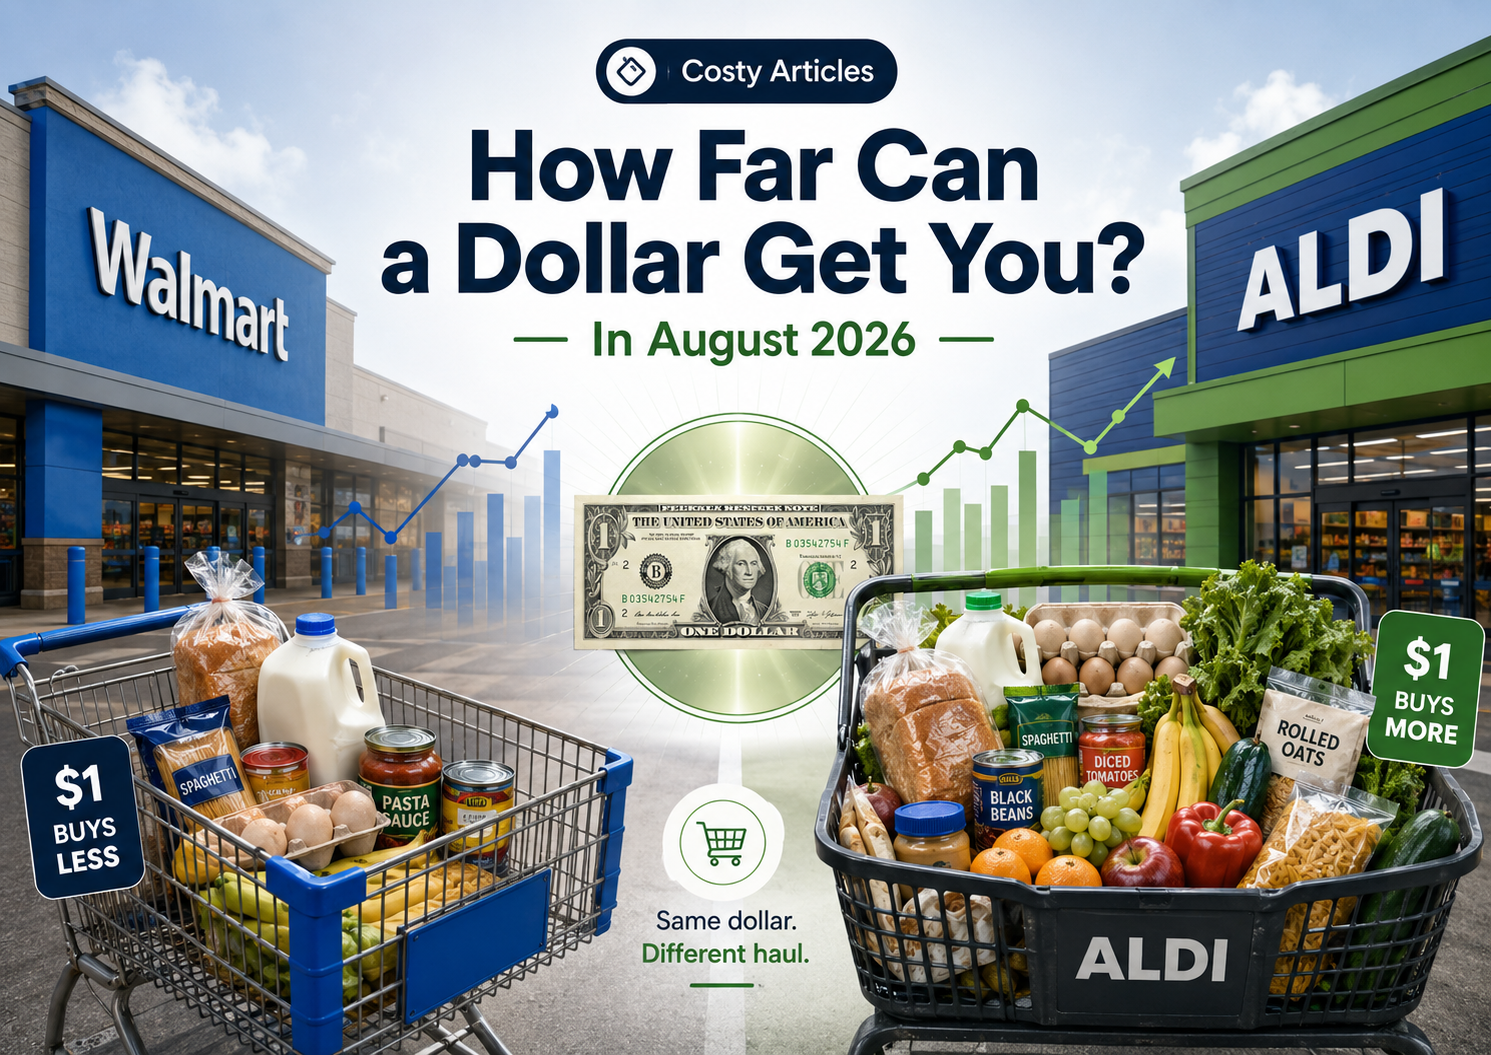
How Far Can a Dollar Get You?
In August 2026
A dollar is still a dollar, but what that dollar can actually buy changes depending on where you shop.
For this analysis, we gathered Costy receipt data from July and August 2026 and compared two of the most frequently visited grocery retailers in our dataset across Missouri and Kansas: **Walmart and ALDI**.
Instead of looking only at the total price of a receipt, we asked a slightly different question:
**How many items did shoppers get for every $1 they spent?**
That gives us a simple way to estimate the **purchasing power of a dollar** at each retailer.
Walmart vs. ALDI
Walmart and ALDI were two of the most frequently visited retailers represented in our July and August data.
Both stores compete heavily on price, but they operate very differently.
Walmart carries an enormous variety of products, brands and product sizes. ALDI generally has a smaller selection and relies heavily on private-label products.
Rather than comparing a handful of individual products, we wanted to see what the receipts themselves told us.
So we calculated:
**Items purchased ÷ subtotal**
For example, if a shopper bought 20 items for $60:
**20 ÷ 60 = 0.33 items per dollar**
That does not mean you can literally walk into the store and buy one-third of an item for $1. It means the shopper paid an average of about **$3 per item**.
Another way of looking at the exact same metric is:
**1 ÷ average item price**
The higher the result, the farther each dollar went.
How to Interpret the Results
Economists often use **Purchasing Power Parity**, or PPP, to compare how much goods and services different currencies can purchase.
At the national level, PPP-adjusted GDP is commonly used to compare the relative size of economies after accounting for differences in local prices.
The idea behind our calculation is similar, although our Costy metric is much simpler and should not be confused with the formal economic definition of PPP.
We are essentially asking:
**If two shoppers spend the same amount of money, which store tends to put more items in the cart?**
That makes the metric useful for thinking about everyday grocery purchasing power.
The Results
Purchasing Power
ALDI Takes the Lead
The most noticeable pattern in the chart is how consistently ALDI sits above Walmart.
Across the dates where we have ALDI observations, shoppers generally received around **0.28 to 0.36 items for every dollar spent**.
That translates roughly to an average price of:
- **0.28 items/$1 → $3.57 per item**
- **0.32 items/$1 → $3.13 per item**
- **0.36 items/$1 → $2.78 per item**
Walmart's observations more commonly sit around **0.15 to 0.22 items per dollar**, equivalent to approximately:
- **0.15 items/$1 → $6.67 per item**
- **0.18 items/$1 → $5.56 per item**
- **0.22 items/$1 → $4.55 per item**
In other words, within this dataset, the average ALDI shopping basket generally contained more individual items for the same amount of money.
There are exceptions.
Walmart reached **0.40 items per dollar on July 31**, one of the strongest values anywhere in the dataset. Individual shopping trips can vary dramatically depending on what was purchased, sales, quantities and product categories.
The broader pattern, however, still favors ALDI.
What Does $20 Look Like?
The ratios become easier to understand when we turn them into an imaginary shopping budget.
Suppose we use a representative value of:
**ALDI: 0.32 items per dollar**
A $20 budget would correspond to approximately:
**20 × 0.32 = 6.4 items**
Now consider Walmart at approximately:
**Walmart: 0.19 items per dollar**
The same $20 would correspond to:
**20 × 0.19 = 3.8 items**
Obviously nobody is leaving Walmart with 0.8 of a cereal box.
These values are averages across a basket, but they illustrate the difference surprisingly well.
In our receipt data, the same dollar frequently stretched farther at ALDI.
There Is an Important Catch
This metric is useful, but it does **not** prove that every product at ALDI is cheaper than the equivalent product at Walmart.
A receipt containing bananas, canned vegetables and bread will naturally have a much higher items-per-dollar ratio than a receipt containing steak, laundry detergent and a large bag of pet food.
Product sizes matter too.
A $7 package containing twice as much product may offer better value than a $4 package, even though our simple item-count metric would treat both as one item.
That means this chart measures the **purchasing power of the shopping basket**, not a perfect product-for-product price comparison.
As Costy's dataset grows, combining this metric with product categories, quantities and unit prices should make these comparisons considerably more powerful.
So, How Far Did a Dollar Go?
Based on Costy's July and August 2026 receipt data, the answer is fairly clear:
**A dollar generally bought more individual items at ALDI than at Walmart.**
ALDI frequently produced values around **0.30 or more items per dollar**, while Walmart more commonly remained closer to **0.20 items per dollar**.
For someone trying to stretch a grocery budget, that difference can become meaningful across an entire month of shopping.
But perhaps the more interesting takeaway is that grocery affordability doesn't always need to be described using abstract inflation percentages.
Sometimes the easiest question is simply:
**How much stuff did my money actually buy?**
And that is exactly the kind of question we want Costy's data to help answer.
A Note About the Data
This analysis is based on receipts available in Costy's dataset from July and August 2026 across shoppers and stores represented in Missouri and Kansas. We took a look at 41 receipts from this period, 531 bought items and 239 relevant staple products.
It should not be interpreted as a comprehensive study of every Walmart or ALDI location, nor does it guarantee that one retailer will be cheaper for every individual product.
As more receipts are added to Costy, these comparisons should become increasingly representative of real-world shopping behavior.
Check out our other artiles:
- [How we save money in 2026](https://costy.org/costy/articles/how-we-save-money-in-2026)
- [Where are the savings hidden](https://costy.org/costy/articles/where-are-the-savings-hidden)
- [State of the food basket](https://costy.org/costy/articles/state-of-food-baskets)